Lighting Cabinet, Multi-channel LED, Daylight & Blackbody Simulator, Image Evaluation, Camera Calibration, Visual Assessment
PMCC- The Future of Colour Rendition
Abstract
A colour rendition chart, named Preferred Memory Colour Chart (PMCC), has been produced. It includes 30 colours, diving into three groups: preferred memory colours, reference colour gamut and a grey sale. The methods to derive these colours and the colour specification of each colour were covered. Its applications were also introduced.
1.Introduction
XRite ColorChecker chart (XCCC) [1], which has been widely used in imaging industry for five decades, as a colour reproduction target. It has been widely used to build colour correction metric for cameras under different illuminants, to check the fidelity against the image on displays. The chart has been widely used for evaluating cameras’ quality in terms of colour accuracy, white balance, tonal response, noise or signal to noise ratio (SNR), etc. It also includes some memory colours, by reproducing the measurement results of some familiar objects. It can be concluded it has been widely used to achieve successful colour reproduction.
However, it has been realised that users are more appreciate pleasing images rather than accurate images. Hence, Hunt [2] differentiate the fidelity against preferred colour reproductions.
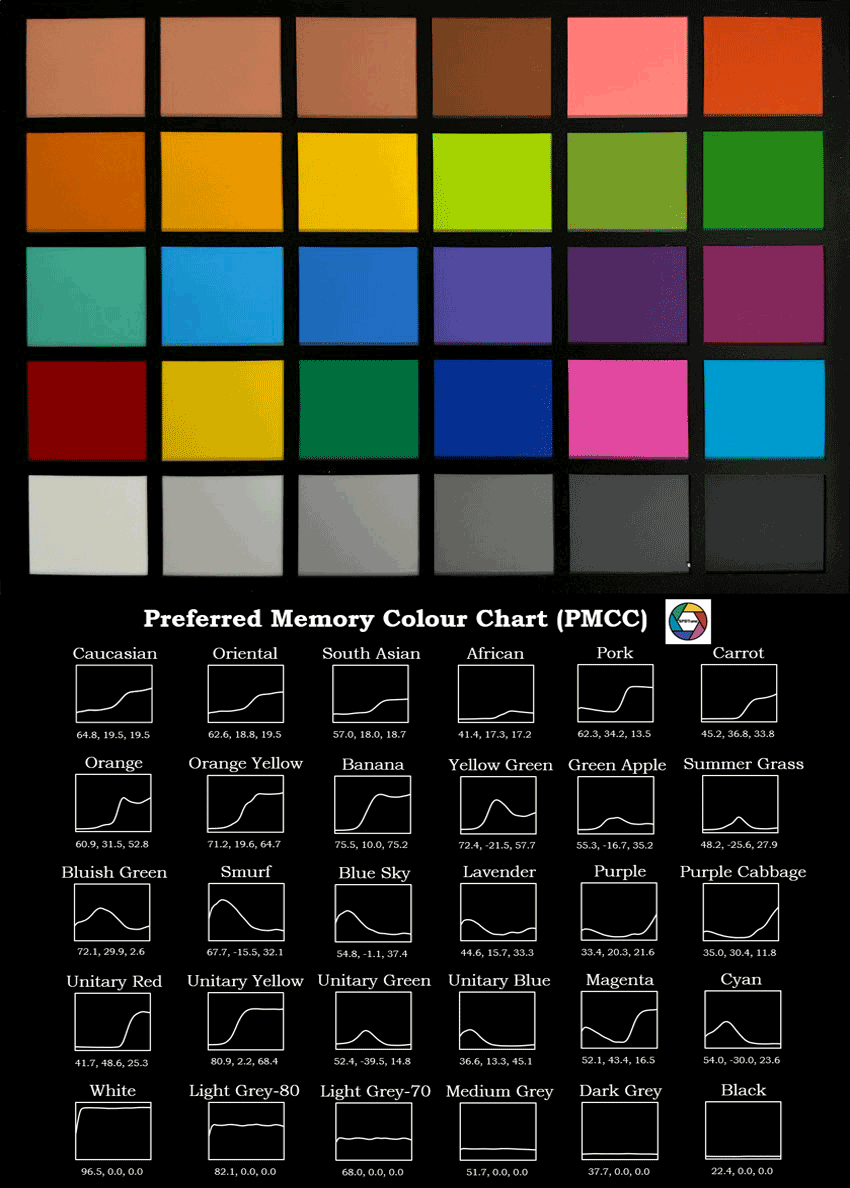
Preferred Memory Colour Chart (PMCC) as shown in Fig. 1 was intended to provide a tool for evaluating the device quality image quality of ‘preference’. It includes preferred memory colours, unitary hue colours, colour gamut boundary colours and a neutral scale. The latter two are similar to those of XCCC colours. However, preference could be quite subjective according to different culture backgrounds, trades, applications. So, many investigations have been carried out to quantify the preferred colours in our research group [3-11]. This will be introduced in Section 3.
Overall, PMCC can be considered as a supplement to the XCCC for many applications.
2.Physical specification of PMCC
The PMCC is designed in the same size as XCCC, 19.6 by 29 cm2. It includes 30 patches in a 5 × 6 grid, each having 4 by 3.3 cm2. Each colour was made by matte paint applied to smooth paper, and surrounded by a black border. The caption of Fig. 1 gives the colour name for each colour.
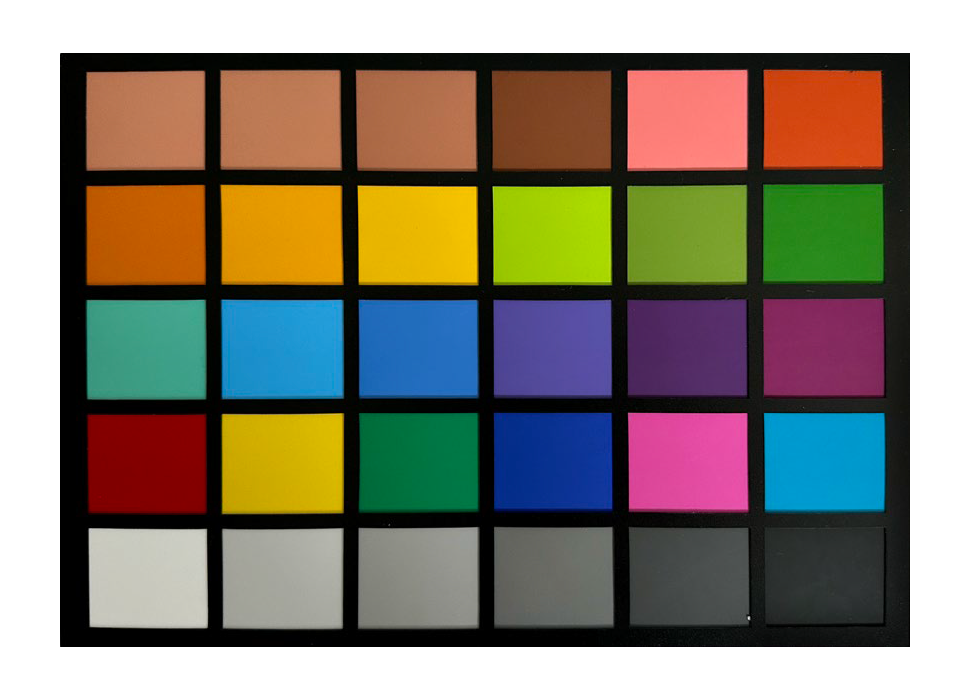
Fig. 1 The PMCC chart including: The 1st row [1) Caucasian, 2) Oriental, 3) South Asian, 4) African, 5) Pork, 6] Carrot]; The 2nd row [7) Orange, 8) YR, 9) Banana, 10) YG, 11) Green apple, 12) Grass]; The 3rd row [13) BG, 14) Smurf, 15) Blue sky, 16) Lavender, 17) PR, 18) Purple Garbage]; The 4th row [ 19) Unitary red, 20) Unitary yellow, 21) Unitary green, 22) Unitary blue, 23) Cyan, 24) Magenta]; and The 5th row [ 25) White, 26) Grey-80, 27) Grey-70, 28) Grey-50, 29) Grey-35, 30) Black].
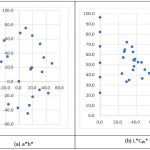
Each PMCC colour was measured by a Konika-Minolta CM700d using d/8 geometry, large size, UV excluded conditions. The results are reported in XYZ, CIELAB under D65/10o conditions. The colour specifications of the PMCC colours are defined in Table 1. Each colour is plotted colours in CIELAB a*b* and L*Cab* planes (see Fig. 2(a) and Fig. 2(b) respectively). Their reflectance functions are also plotted in Fig. 3.
Table 1. The CIELAB values of the PMCC colours
| Name | L* | a* | b* | C*ab | h ab | |
| 1 | Caucasian | 64.8 | 19.5 | 19.5 | 27.5 | 45.1 |
| 2 | Oriental | 62.6 | 18.8 | 19.5 | 27.1 | 46.1 |
| 3 | South Asian | 57.0 | 18.0 | 18.7 | 26.0 | 46.2 |
| 4 | African | 41.4 | 17.3 | 17.2 | 24.4 | 44.8 |
| 5 | Pork | 62.3 | 34.2 | 13.5 | 36.8 | 21.5 |
| 6 | Carrot | 45.2 | 36.8 | 33.8 | 49.9 | 42.6 |
| 7 | Orange | 60.9 | 31.5 | 52.8 | 61.5 | 59.2 |
| 8 | Orange Yellow | 71.2 | 19.6 | 64.7 | 67.6 | 73.1 |
| 9 | Banana | 75.5 | 10.0 | 75.2 | 75.8 | 82.4 |
| 10 | Yellow Green | 72.4 | -21.5 | 57.7 | 61.6 | 110.5 |
| 11 | Green Apple | 55.3 | -16.7 | 35.2 | 39.0 | 115.4 |
| 12 | Summer Grass | 48.2 | -25.6 | 27.9 | 37.9 | 132.6 |
| 13 | Bluish Green | 72.1 | -29.9 | 2.6 | 30.0 | 175.1 |
| 14 | Smurf | 67.7 | -15.5 | -32.1 | 35.7 | 244.3 |
| 15 | Blue Sky | 54.8 | -1.1 | -37.4 | 37.4 | 268.3 |
| 16 | Lavender | 44.6 | 15.7 | -33.3 | 36.8 | 295.2 |
| 17 | Purple | 33.4 | 20.3 | -21.6 | 29.7 | 313.2 |
| 18 | Purple Cabbage | 35.0 | 30.4 | -11.8 | 32.6 | 338.7 |
| 19 | Unitary red | 41.7 | 48.6 | 25.3 | 54.7 | 27.5 |
| 20 | Unitary yellow | 80.9 | 2.2 | 68.4 | 68.4 | 88.2 |
| 21 | Unitary green | 52.4 | -39.5 | 14.8 | 42.2 | 159.4 |
| 22 | Unitary blue | 36.6 | 13.3 | -45.1 | 47.0 | 286.4 |
| 23 | Magenta | 52.1 | 43.4 | -16.5 | 46.40 | 339.20 |
| 24 | Cyan | 54.0 | -30.0 | -23.6 | 38.12 | 218.19 |
| 25 | White | 96.5 | 0.0 | 0.0 | 0.00 | - |
| 26 | Grey-80 | 82.1 | 0.0 | 0.0 | 0.00 | - |
| 27 | Grey-70 | 68.0 | 0.0 | 0.0 | 0.00 | - |
| 28 | Grey-50 | 51.7 | 0.0 | 0.0 | 0.00 | - |
| 29 | Grey-35 | 37.7 | 0.0 | 0.0 | 0.00 | - |
| 30 | Black | 22.4 | 0.0 | 0.0 | 0.00 | - |
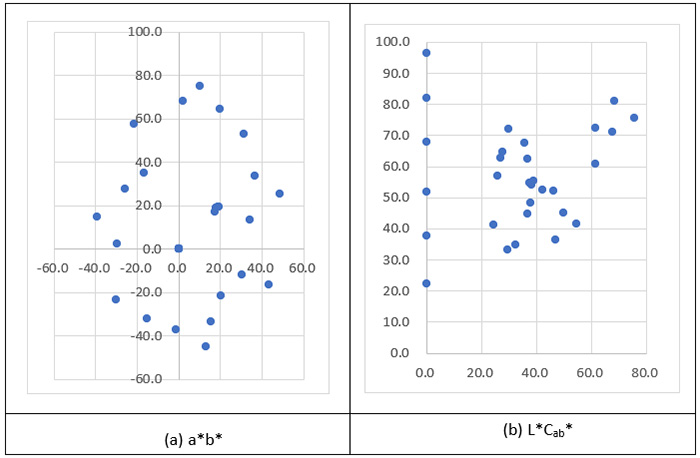
Fig. 2 The PMCC samples in CIELAB a) a*b* and b) L*Cab* planes.
3.Design of Individual Colours
The colours in each row of PMCC will be introduced, he numbers in the bracket for each colour corresponds to those in Figure1 and Table 1. The colours are divided into 3 groups: ‘preferred memory’, ‘colour gamut’, and ‘neutral scale’.
3.1Preferred memory colours
The colours in the first three rows are in the ‘preferred memory’ group. These were obtained by a series of psychophysical experiments [3-11]. Each original image, say banana, was rendered say 16 colours, surrounding the centre in each of the a*b*, L*a*, L*b* planes. Observers assessed the 48 rendered images using a threshold method [5] on displays, i.e. ‘preferred’ or ‘not preferred’. Eqns. (1) and (2) were adopted to establish preferred memory colour centre and 50% acceptability ellipsoid for a particular memory colour.

and

where Li, ai*, bi* are the mean values of the Ith rendered image. The preferred colour centre, (L0*, a0*, b0*), k1 to k4 and α are the eight parameters optimized by maximizing the correlation coefficients between the predicted data (Pp%) and visual data (Pv%).
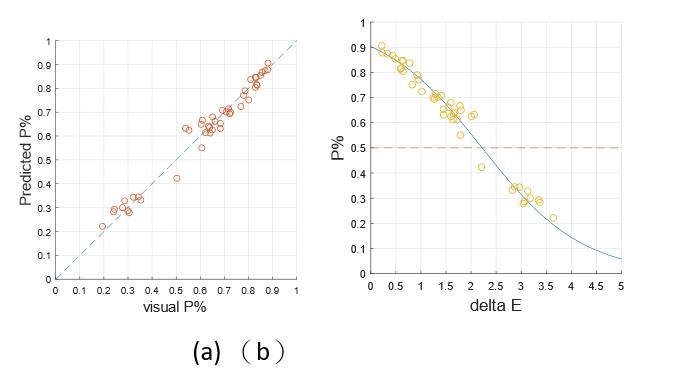
Figure 3. Comparison (a) between referred model predicted result (Pp%) and the experimental visual result (Pv%), and (b) between the model predicted data (Pp%) and calculated delta E values (Eq. (2)).
Figure 3 plots the model predicted data (Pp%) from Eq. (1) against (a) visual data (Pv%), and b) the calculated E values from Eq. (2), where the blue dashed line and blue curve represent the 45o line and the function of eq. (2), respectively. It can be seen that the Pp% and Pv% values agree well in Figure 3(a), and the Eq. (1) function gave good curve fit to the visual data (Pv%). The Cao and Luo’s 24 ellipses [11] are plotted in a*b* plane in Figure 4, for which 24 preferred memory colour centres were studied. But only 14 colours are used in PMCC to give a good coverage in colour space. Note that there were xx memory colours were studied. The digital images were displayed on 10 calibrated Huawei P2 mobile phones. The experiments were carried out in UK and China by 106 observers from Caucasian (21), Oriental (43), South Asian (31) and Africans (11). Each observer scaled an image in terms of preference, naturalness and colourfulness. In fact, large number of the data were accumulated. To produce the PMCC targe, the preferred results is used based on average from all 4 groups.
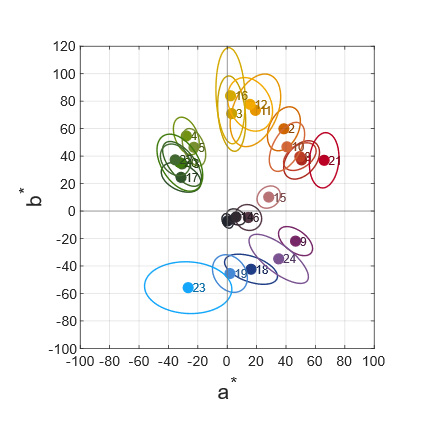
Figure 4 The Cao and Luo’s 24 ellipses are plotted in a*b* plane
The colours in the last two rows are applied for the evaluation of colour management systems. Row 4 colours represent the primary colours of a colour printer – red (19), green (20), Yellow (21), blue (22), cyan (23), and magenta (24). They can be used to form a reference gamut to compare with the colour gamut of various colour reproduction systems such as colorant, camera, and display systems. Most importantly, the former 4 are the unitary colours, having pure red, yellow, green and blue perceptions [12], corresponding to the memory colours used to evaluate the special colour rendering of index, (CIE-Ra [13]), and special indices (R9, R10, R11, R12).
The last row colours (25-30) form the ‘neutral colour’ group, varying in lightness from L* values of 22.4 to 96.5. These colours can be used to set up the grey balance for an imaging system, i.e. to ensure the grey scale remain neutral appearance.
4.Production of colour patches
The final stage was to reproduce the above colours as colour patches. A number of physical objects for each ‘preferred memory colour’ were first collected and measured using a d/8 sphere-based spectrophotometer. The average value from 20 measurements was taken as standard. The average colour in L*, a*, b* values and spectral reflectance function were used to represent a colour.
From the experimental results, it was found that the preferred memory colours are usually brighter and more colourful colours than the real measured colours. Computer formulation was performed using Lacquer paint to reproduce these colours with a goal to produce spectra match as close as possible. Few colours were not able to reproduce due to out of the colour gamut of the paint system. The general principle is to match the target colour to have the similar shape to those measured.
Strict colour tolerance is applied between different charts. All charts to agree with the production standard to have less than one CIEDE2000 colour difference.
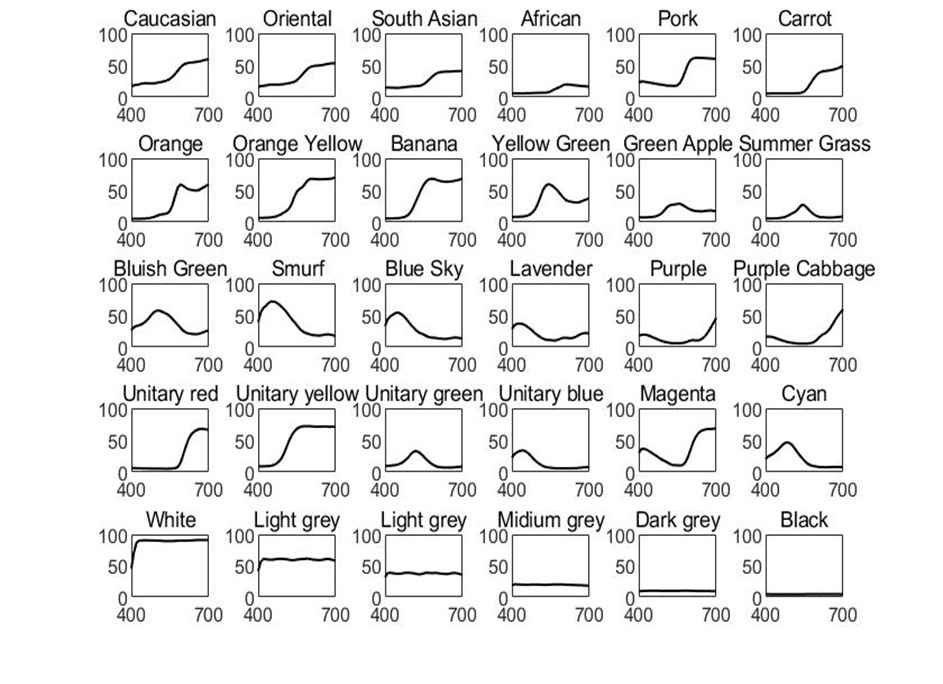
Fig. 5 The spectral reflectance functions of all the PMCC colours
5.Applications
Table 2 summarises the colour quality metrics (CQM) and tools can be used for the three application areas: camera, display and lightings.
Table 2. A summary of the applications of PMCC for camera, display and lightings.

A brief account for each application is listed below, and they are divided into Colour Quality Matric (CQM) and Tool, respectively.
5.1 Tools
1.Building device characterisation models to transform between the device signals (RGB) and CIE XYZ values in the colour management for digital devices. Typical models include generic metrics of 1D- and 3D- LUT [14], analytical metrics of GOG [15], Polynomial [16] etc.
2.For routine mobile camera, PMCC can be used to construct colour correction matric to achieve camera accuracy under different illuminants.
3.Creating the Inter-Color Consortium (ICC) colour management profiles [17], such as Gamma or 1D-LUT for displays, or 3D-LUT for printers. There are many applications software such as Adorbe Lightroom®, Photoshop®, which use ICC colour management system.
4.To develop computational algorithms for achieving AWB [18] and preferred colour rendering [19] in Image signal processing.
5.To perform grey tracking for grey scale colours to appear almost perfect neutral appearance.
5.2 Colour Quality Metrics
1.Neutrality: To measure the difference between the target in Table 1 and measured CIE specifications for the 6 neutral colours (25-30) by a characterisation model for display or camera device.
2.Colour gamut: To construct a reference gamut based upon Gamut Boundary Descriptor Ring (GBDring) method [20,21] in CAM16-UCS space [22] to use the PMCC white (25), black (30), unitary red (19), unitary yellow (20), unitary green (21), unitary blue (22), cyan (23) and magenta (24). It can be used to calculate the ratio between the gamut volume of reference and that of a display or camera.
3.Pure hue shift: To plot the unitary red (19), unitary yellow (20), unitary green (21), unitary blue (22) colours in CAM16-UCS Hue Composition (Hc) and Chroma plane, and to report the mean Hc of the 4 colours. For perfect hue reproduction, the 4 colours should be located in the C and Hc axes.
4.Preferred metric: To calculate the 14 preferred memory metrices from Eqs. (1) and (2). The scale is between 0% (not preferred) and 100% (preferred). 50% corresponds to the threshold. An example is given in Table 3 for a camera.
Table 3. The Preferred metric of a camera for the 14 PMCC colours.
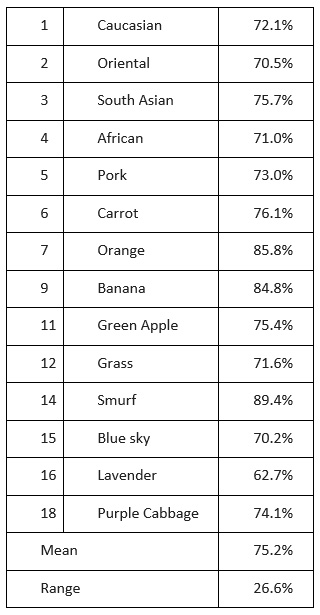
The preference score is arranged between 0 (dislike) and 100 (like). A better camera quality should have the average score close to 100, and a smaller spread. In this camera, the quality is considered to be passed. A grading system can be established after the evaluation by many devices, e.g., 100 (Excellent quality)-90 (Good quality)-80 (fare)-70 (pass)-60 70 failed etc.
6.Skin metric: One of the subsets of Preference metrics for the 4 types of skin colours (Caucasian (1), Oriental (2), South African (3), African (4)). Taking the above example, the skin preference index is 72.3.
7.Colour rendering: This is particular for the illumination industry. The current colour rendering indices are Ra [13] and Rf [23], respectively, and are used to evaluate the colour quality of a test source comparing with a reference illuminant. The 4 skin together with 4 unitary PMCC colours can be us in the Ra as special colour rendering index to replace the existing colours. In fact, all PMCC memory colours can be used as special CRI samples. Most importantly, the PMCC surface colours can be visually checked against the test source against their memory colours.
5.3 Image Signal Processing
Various ISP algorithms can be developed to produce high quality images close to those memory colours, to perform AWB [18], preferred reproduction [19].
Finally, possibly the most important usage is to provide as a visual aid or reference colours to check the performance of colour accuracy or of colour preference. Trust your eyes!!
Conclusions
A new colour target, PMCC, has been produced. It’s design, manufacturing, and theory have been introduced. It has three major applications, a physical target to characterise imaging devices, to evaluate the objective and subjective quality of devices or images. Quality, and to provide a visual aid to check the cross-media colour reproduction, or lighting quality.
References
1.C. S. McCamy, H. Marcus, J. G. Davidson, A color-rendition chart, Journal of applied photographic Engineering, 2:3 (1976) 95-99.
2.R. W. G. Hunt, The reproduction of colour, 2004, Willey, New York.
3.H. Z. Zeng and M. R. Luo, Colour and tolerance of preferred skin colours on digital photographic images, Color Res. Appl. 38(2013), pp30-45
4.S. H. Chen, H. S. Chen, N. Ohta and M. R. Luo, The effect of chromatic and lightness components for preferred skin color reproduction on a display, Jol. of Ima. Sci. Tech., 57(2013), pp30501-1-12
5.Y. T. Zhu, M. R. Luo, S. Fischer, P. Bodrogi and T. Q. Khanh, Long-term memory color investigation: culture effect and experimental setting factor, Journal of the Optical Society of America A, 34(2017), pp1757-1768
6.Y. Z. Wang, M. R. Luo, M. Wang, K. Xiao K, M. Pointer. Spectrophotometric measurement of human skin colour. Color Res Appl. 42(2017), pp764–774.
7.M. M. Wang, M. R. Luo, M. Wang, K. Xiao K, M. Pointer. Spectrophotometric measurement of human skin colour. Color Res Appl. 42(2017), pp764–774
8.D. Tian, C. Li, M. R. Luo, Image naturalness model based on prototypical memory colors (sky, grass, and skin), Col. Res. Appl., 2022, pp1-14, DOI:10.1002/col.22781.
9.M. Cao, M. R. Luo, Preferred skin tones on mobile displays under illuminants having different correlated colour temperatures, Vision research, 198(2022), pp 108060-108072
10.R. Peng, M. R. Luo, Y. Zhu, X. Liu and M. R. Pointer, Preferred skin reproduction of different skin groups, Vision Res. 207 pp108210, 2023.
11.M. Cao, and M. R. Luo, A study of preferred and natural memory colours across different ethnic groups, , Color Research and Application 48 (2023)178-200.
12.B. Zhao and M. R Luo, Hue linearity of color spaces for wide color gamut and high dynamic range media, J. Opt. Soc. Am. A 37(2020), pp865-875..
13.CIE 013.3-1995 Method of measuring and specifying colour rendering properties of light sources
14.H. R. Kang, Computational Color Technology, SPIE Press, Bellingham, WD USA.
15.R. Berns, Methods for characterizing CRT displays, 16(1996)173-182.
16.G. Hong, M. R. Luo and P. A. Rhodes, A Study of Digital Camera Colorimetric Characterisation Based on Polynomial Modelling, Color Res. Appl.. 26 (2001) 76-84.
17.ICC.2:2019 (Profile Version 5.0.0-iccMAX) Image Technology colour management – extensions to archichitecture, profile format and data structure, @ICC 2019 International Color Conbsortium.
18.L. Wang and M. R. Luo, To perform white balance using skin memory color, International Colour Association (AIC) 2023.
19.H. Z. Zeng and M. R. Luo, A Preferred Skin Color Enhancement Method for Photographic Color Reproduction, Proc. SPIE: Color Imaging: Device-Independent Color, Color Hardcopy, and Graphic Arts , (2011).
20.L. Xu, C. Xu, M. R. Luo, Accurate gamut boundary descriptor for displays, Optics Express, 30(2)(2022), pp1615-26.
21.L. Xu, Q. Ye, M. R. Luo, Estimation of the perceptual color gamut on displays, Optics Express, 30(18), 43872-43887 (2022)
22.C. J. Li. Z. Li, Z. Wang, Y. Xu, M. R. Luo, G. H. Cui, M. Melgosa, M. H. Brill, and M. R. Pointer, Comprehensive color solutions, CAM16, CAT16 and CAM16-UCS, Col., Res. and Appl., (2017), pp42703-718.
23.CIE 177:2007 Colour rendering of white LED light sources
Most People like
-
 PMCC- The Future of Colour Rendition 9744
 -
 A Practical Guide for Color Managers- THE SECOND C: COLOR WITH A PURPOSE (Part 1) 7185
 -
 A Practical Guide for Color Managers- THE SECOND C: COLOR WITH A PURPOSE (Part 2) 6167
 -
 What You See is What You Get! Introducing LEDSimulator: The Total Appearance Color Communication Platform 5546
 -
 Precision in Color Management: How RAL Standards and CMF Design Influence Industrial Color? 4890
 -
 Preserving Light and Shadow: How Spectrally Tunable LEDs Safeguard Global Art and Cultural Heritage 1854
 -
 How Cameras “See True Color” — Exploring the Critical Role of Multi-Channel LED Calibration Light Sources in Camera Production Lines 1460
Random Article
- 2022-07-05 What You See is What You Get! Introducing LEDSimulator: The Total Appearance Color Communication PlatformUnlike traditional color communication methods, LEDSimulator offers a real-time, error-free total appearance color management system. It enables instant reproduction of colors, textures, and translucency, ensuring consistency, speed, and accuracy in color communication across the global supply chain between designers, brands, and manufacturers. This not only reduces communication costs significantly but also shortens the time-to-market for products. Through the LEDSimulator viewing window, designers, brand managers, and manufacturers can bypass time-consuming sample production and shipping. They can easily specify and verify fabrics’ color and texture in their full appearance, providing a seamless and efficient communication platform for color and texture matching. Since its…
- 2022-08-05 A Practical Guide for Color Managers- THE SECOND C: COLOR WITH A PURPOSE (Part 1)The American Association of Textile Chemists and Colorists (AATCC) is an industry advocacy group focusing on the effective application of color and functional finishes on textiles. Textiles are used in many sectors including transportation, military/government, industrial, medical/ healthcare, sports/fitness, and fashion, thus the business and end-use requirements vary widely. As we see rapid changes in global business, AATCC “continues to evolve to meet the needs of those in the ever-changing textile, apparel, and materials industries.” [1] The textile, apparel, and materials industries are huge. The global apparel retail market drives about US$1.8 trillion in revenue. [2] Textile mills and apparel…
- 2025-10-09 How Cameras “See True Color” — Exploring the Critical Role of Multi-Channel LED Calibration Light Sources in Camera Production LinesWhy Do Cameras “See Colors Wrong”? Have you ever noticed that two cameras capture the same scene with noticeably different colors? One of the main reasons lies in the light source used during production and testing. A camera’s “eyes” — its image sensors — are highly sensitive to light. If the spectral power distribution (SPD) of the test light source is unstable, the camera may misinterpret colors or brightness. That’s why controllable, spectrally stable light sources are essential in both camera production lines and laboratories. Among these, multi-channel spectrally tunable LED light sources are increasingly adopted by manufacturers and research…
- 2025-02-10 Precision in Color Management: How RAL Standards and CMF Design Influence Industrial Color?In the World of Color, Precision Matters More Than You Think! From smartphones and automobiles to architecture, home appliances, and medical equipment, color, material, and finish (CMF) design plays a crucial role in shaping our visual experiences. In industrial manufacturing, ensuring color consistency and stability is essential, as it directly impacts brand identity, product quality, and consumer purchasing decisions. But did you know? The same color can appear drastically different under different lighting conditions! This is why color standardization and precise control are critical in industrial design, brand marketing, and manufacturing processes. This necessity is at the heart of both…
- 2022-08-06 A Practical Guide for Color Managers- THE SECOND C: COLOR WITH A PURPOSE (Part 2)Color Inspiration at a Design-Driven Brand According to Yun Chen, choosing colors is like exploring a “lonely, uncharted wilderness.” [5] It is up to a designer’s talent and vision to select a collection of colors to represent the aesthetic of a design concept. Some designers see new colors clearly in their mind’s eye and need a way to document them. Others go exploring in stores, galleries. This textile series will share technical insights and wisdom of AATCC members. The "Second C" series will focus on color. If you wish to contribute your own technical insights on topics of interest to AATCC…
- 2023-09-15 PMCC- The Future of Colour RenditionAbstract A colour rendition chart, named Preferred Memory Colour Chart (PMCC), has been produced. It includes 30 colours, diving into three groups: preferred memory colours, reference colour gamut and a grey sale. The methods to derive these colours and the colour specification of each colour were covered. Its applications were also introduced. 1.Introduction XRite ColorChecker chart (XCCC) [1], which has been widely used in imaging industry for five decades, as a colour reproduction target. It has been widely used to build colour correction metric for cameras under different illuminants, to check the fidelity against the image on displays. The chart…
- 2025-08-25 Preserving Light and Shadow: How Spectrally Tunable LEDs Safeguard Global Art and Cultural HeritageLight. Protection. Challenges. Light is the medium through which art is brought to life, but improper illumination can also become a potential threat to cultural heritage. Research indicates that organic pigments—particularly red and yellow—are highly susceptible to fading or degradation when exposed to inappropriate lighting conditions, with significant damage occurring in just a few months. To combat this, leading museums around the world are increasingly adopting spectrally tunable LED lighting technology. Not only does this technology offer outstanding energy efficiency, but it also represents a breakthrough in precise spectral control: effectively filtering out harmful UV/IR radiation, regulating blue light levels,…


